![Alcohol and Cannabis Retail Regulations During the COVID-19 Pandemic in Canada [March 1, 2021]](/sites/default/files/styles/hero_feed_ccsa_505_x_357/public/2021-04/CCSA-COVID-19-Alcohol-Cannabis-Retail-Regulations-During-Pandemic-Canada-04-2021-en.jpg?h=23a593d3&itok=hgM0IDUE)
Alcohol and Cannabis Retail Regulations During the COVID-19 Pandemic in Canada [March 1, 2021]
These policy tracking tables provide details about changes to alcohol and cannabis retail regulations during the pandemic.
![Consultation on the Cannabis Regulations: Cannabis Research and Other Regulatory Issues [Policy Brief]](/sites/default/files/styles/hero_feed_ccsa_505_x_357/public/2021-03/CCSA-Consultation-Cannabis-Regulations-Research-Policy-Brief-2021-en.jpg?h=81017902&itok=aUZLLHIc)
Consultation on the Cannabis Regulations: Cannabis Research and Other Regulatory Issues [Policy Brief]
Outlines key considerations submitted to Health Canada’s Consultation on the Cannabis Regulations: Cannabis research and other regulatory issues.
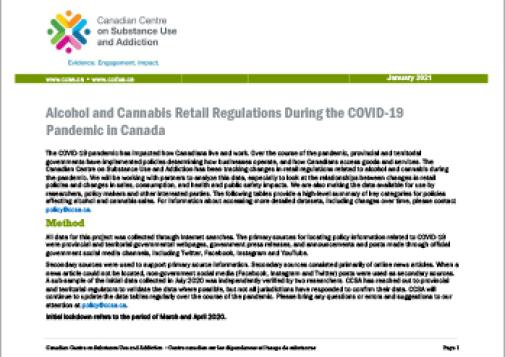
Alcohol and Cannabis Retail Regulations During the COVID-19 Pandemic in Canada [initial lockdown March/April 2020]
These policy tracking tables provide details about regulatory changes to alcohol and cannabis retail during the pandemic.
![Maintaining a Public Health Approach to Alcohol Policy During COVID-19 [Policy Brief]](/sites/default/files/styles/hero_feed_ccsa_505_x_357/public/2021-01/CCSA-COVID-19-Maintaining-a-Public-Health-Approach-to-Alcohol-Policy-Brief-2021-en.jpg?h=1d349f46&itok=AVVXwYXf)
Maintaining a Public Health Approach to Alcohol Policy During COVID-19 [Policy Brief]
This policy brief identifies ways to address higher-risk alcohol use during the COVID-19 pandemic.
![Cannabis Retail During COVID-19 [Policy Brief]](/sites/default/files/styles/hero_feed_ccsa_505_x_357/public/2021-01/CCSA-COVID-19-Cannabis-Retail-Policy-Brief-2021-en.jpg?h=1d349f46&itok=tP2axrIv)
Cannabis Retail During COVID-19 [Policy Brief]
This policy brief provides an overview of cannabis regulatory changes made in response to the COVID-19 pandemic between March and August 2020 and presents preliminary data on changes to cannabis sa
![Substance Use Treatment in the Northwest Territories 2016–2017 [infographic]](/sites/default/files/styles/hero_feed_ccsa_505_x_357/public/2021-01/CCSA-NTI-Northwest-Territories-2016-2017-Data-Infographic-2021-en.jpg?h=23a593d3&itok=-O73vrol)
Substance Use Treatment in the Northwest Territories 2016–2017 [infographic]
Illustrates data on substance use treatment in the Northwest Territories in 2016–2017.
![Substance Use Treatment in Newfoundland and Labrador 2016–2017 [infographic]](/sites/default/files/styles/hero_feed_ccsa_505_x_357/public/2021-01/CCSA-NTI-Newfoundland-and-Labrador-2016-2017-Data-Infographic-2021-en.jpg?h=23a593d3&itok=B6Q2Lx-c)
Substance Use Treatment in Newfoundland and Labrador 2016–2017 [infographic]
Illustrates data on substance use treatment in Newfoundland and Labrador in 2016–2017.
![Substance Use Treatment in Prince Edward Island 2016–2017 [infographic]](/sites/default/files/styles/hero_feed_ccsa_505_x_357/public/2021-01/CCSA-NTI-Prince-Edward-Island-2016-2017-Data-Infographic-2021-en.jpg?h=23a593d3&itok=ioben54I)
Substance Use Treatment in Prince Edward Island 2016–2017 [infographic]
Illustrates data on substance use treatment in Prince Edward Island in 2016–2017.


