Putting the Pieces Together, Creating Impact: CCSA Annual Report, 2020–2021
Outlines the activities of CCSA in fiscal year 2020–2021 and provides the auditor’s report.
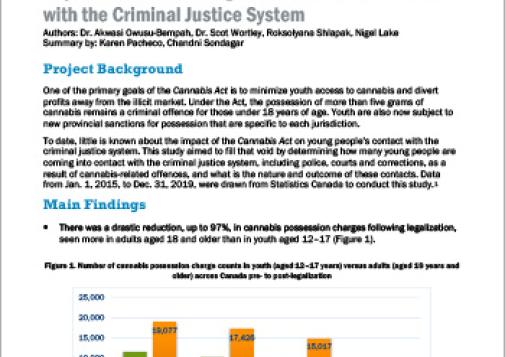
Impact of Cannabis Legalization on Youth Contact with the Criminal Justice System
Dr. Akwasi Owusu-Bempah and Dr.
![Considerations for Virtual Services and Supports for Substance Use and Concurrent Disorders [Policy Brief]](/sites/default/files/styles/hero_feed_ccsa_505_x_357/public/2021-10/CCSA-Virtual-Services-Supports-Substance-Use-Concurrent-Disorders-Policy-Brief-2021-en.jpg?h=d762c6db&itok=sOHi-SEs)
Considerations for Virtual Services and Supports for Substance Use and Concurrent Disorders [Policy Brief]
This policy brief highlights key findings from a national survey of people who use substances about their perceptions of and experiences with accessing virtual services through telemedicine, video
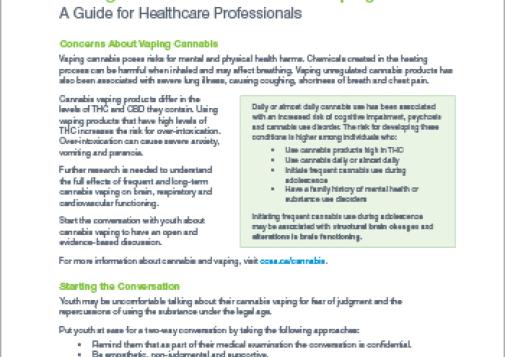
Talking to Youth About Cannabis Vaping: A Guide for Healthcare Professionals
This guide provides healthcare professionals with the questions they need to ask youth to start a meaningful conversation about the risk associated with vaping cannabis.
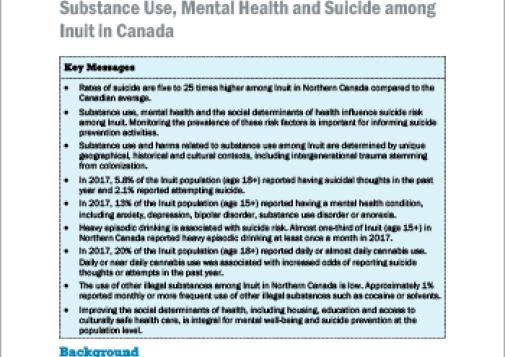
Substance Use, Mental Health and Suicide among Inuit in Canada (Report at a Glance)
Created in partnership with Inuit Tapiriit Kanatami, the national organization representing Inuit across Canada, this report in short summarizes statistics on substance use and mental health among
Risk and Protective Factors for Suicide among Inuit in Canada: A Summary of Statistics Related to Suicide and Mental Health
Created in partnership with Inuit Tapiriit Kanatami, the national organization representing Inuit across Canada, this technical report synthesizes statistics on mental health, substance use and the
Update of Canada’s Low-Risk Alcohol Drinking Guidelines: Summary of Findings from Public Consultation
This report summarizes the findings of a six-week online public consultation held in spring 2021 to inform an update of Canada’s Low-Risk Alcohol Drinking Guidelines.
Cannabis Research in Times of Legalization: What’s on the Agenda
This report is based on a workshop of the same name that was co-organized by CCSA and the Department of Political Science at the University of Zurich.


